Graphite checks
Graphite checks are a lightweight way of monitoring data that is already being fed into your Graphite system for analysis, debugging and optimisation. Cabot makes it possible to alert on that data.
Getting started
To add a new check:
Click New ▾ and then Graphite check.
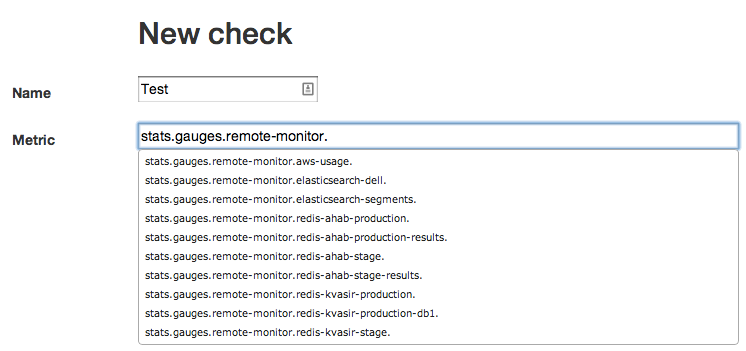
- The only complex form field is the
Metricfield.- This autocompletes based on your Graphite server’s key namespace, but because that namespace gets very messy it can be hard to find the right key.
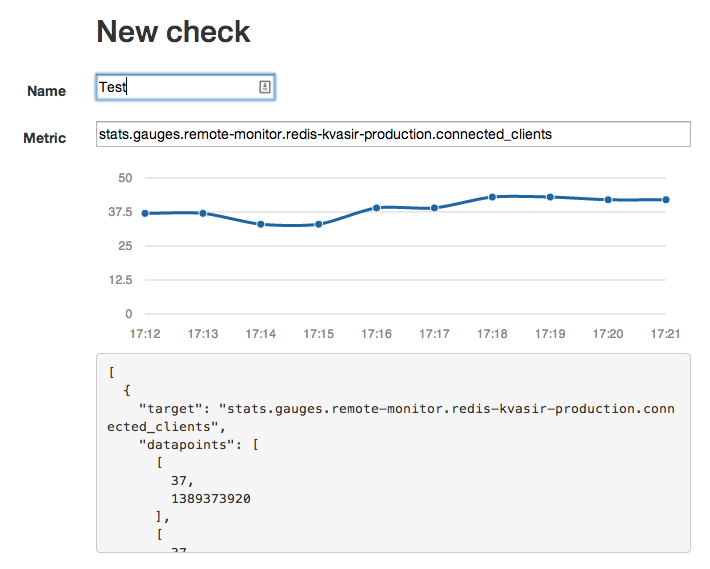
- You can also use more complex expressions, such as
avg(series.*.value)orsum(host1.value,host2.value) - As you type, Cabot will attempt to validate your expression against the server and will show a preview of the raw data feed:
- This autocompletes based on your Graphite server’s key namespace, but because that namespace gets very messy it can be hard to find the right key.
Check typeis the operator that you want to use to test the Graphite data series. Currently Cabot supports the obvious ones (Equals,Greater than,Greater than or equal,Less than,Less than or equal)Valueis the threshold that you want to compare the metric to. You can imagine this as a horizontal line on the preview graph.
A Graphite check will fail if any datapoint in the Metric would cause the expression [Metric] [Check type] [Value] to be true.
For example, if you want to alert when your series hosts.production.*.disk.sda.disk_ops.read spikes above 1.0, you would input:
Metric: hosts.production.disk.sda.disk_ops.read
Check type: Greater than
Value: 1.0
Other options
Importance- if this check fails, the service it relates to will have this status.Expected num hosts- sometimes you want to be sure that a metric is in fact being collected properly (collectdoften seems to crash, etc). Setting this will cause the check to fail if Cabot detects that fewer than this number of hosts are sending metrics to Graphite for this key expression.Expected num metrics- similar toExpected num hosts, but it sets the number of metrics that should fulfil the check criteria in order for the check to pass. For example, if you have 3 metrics in graphite and set this value to 3, your check criteria is >1 and one of metrics becomes 0 you will get an alertDebounce- prevent alerts when a single point (or multiple points) in the data series exceeds the value set. This prevents interruptions by metrics which quickly return to normal.- A value of
2means that no alert will be issued if the check fails twice in a row and then succeeds.
- A value of
All other settings should be self-explanatory.
Why Graphite?
Arachnys originally created Cabot to solve a specific problem: how to use the same metrics from metric collection and visualisation system Graphite that we use for eyeball debugging and monitoring as input for an alerting system?
Graphite still serves as our core source of alert data.
Do I need to use Graphite to use Cabot?
Cabot’s other functionality, including HTTP monitoring, Jenkins job monitoring and alerts, will still work if you don’t use Graphite.
If you use a different service (Ganglia, etc) and would like it to be included, please open an issue on GitHub.
Set up Graphite instance
If you don’t already use Graphite, it’s not difficult to install and provision. There are various scripts on GitHub - caveat utilitor:
- https://github.com/dmichel1/ansible-graphite
- https://forge.puppetlabs.com/dwerder/graphite
You get the idea.
There is also at least one provider of SaaS Graphite/statsd hosting: https://www.hostedgraphite.com/. We can’t vouch for them but it looks like an easy way of having a dabble.