Jenkins checks
Why monitor Jenkins?
Jenkins checks allow you to monitor jobs on your Jenkins build server and alert based on their status.
At Arachnys, we use Jenkins not just to build software and for continuous integration testing, but also as a sort of centralised cron infrastructure.
We regularly run API and Selenium tests against key parts of our infrastructure to ensure that failures that have slipped through other parts of our test defences are quickly caught and repaired.
Cabot is key to that process. Jenkins can send email alerts on test failures but Cabot allows us to escalate those emails to Slack alerts, SMSs and even telephone alerts.
Getting started
Define a JenkinsConfig
Since 0.11.0, Cabot supports multiple Jenkins backends.
To define a backend, add it in the Django admin, in Home › Cabotapp › Jenkins configs › Add jenkins config
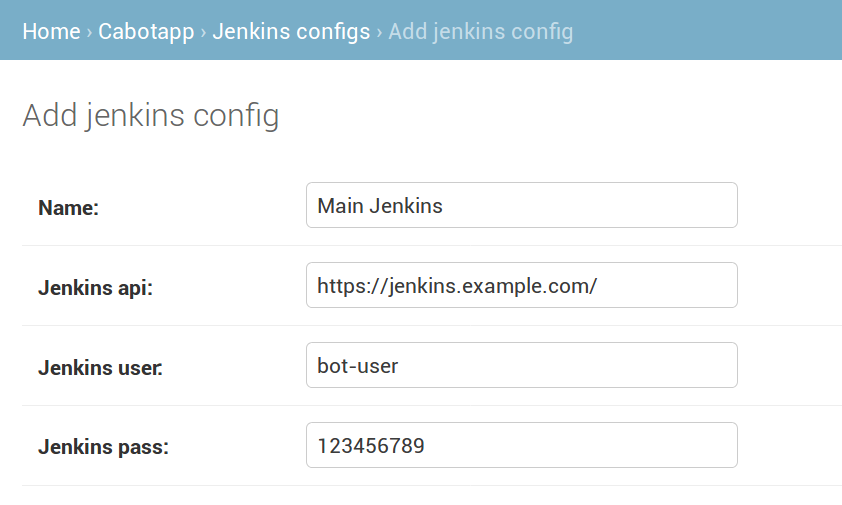
Name: a mnemonic name for that Jenkins instanceJenkins api: The URL to the Jenkins instance, eghttps://jenkins.example.com/Jenkins user/Jenkins pass: The Jenkins username and password for API access
https://cabot.arachnys.com/admin/cabotapp/jenkinsconfig/
Add a check
To add a new check:
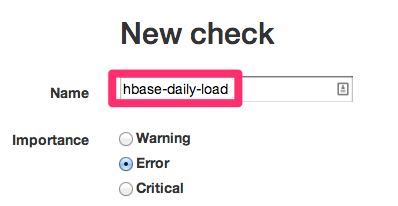
Click New ▾ and then Jenkins check.
The only required form field is Name. Unlike for other checks (where the name can be anything), this must match exactly the title of the Jenkins job that you are monitoring.

should match
If the service is not configured on the server correctly, the check will fail.
Other options:
Debounce- number of consecutive check failures to tolerate.- These do not (yet) correspond to runs of the Jenkins job, rather to attempts to get the status of the Jenkins job.
Max queued build time- fail if a build is waiting in the queue for more than this number of minutes.- We find that occasionally Jenkins jobs can hang, and thus avoid failing outright, for hours or even days. Ensuring that a build is not queued for more than a few minutes prevents this problem.